Custom data collection with advanced teamtags
Updated on 15 Apr 2026
Each Coach has had a thought like:
“I have the feeling that …”
Sometimes that feeling is accurate, but sometimes it isn't. That's why it's valuable to check whether that feeling is actually correct. The best way to do this is by collecting and analyzing data.
In TeamTv, we've developed a new feature for this: custom teamtags. With this, you can tag actions on the field and extract data from them. This way, you can back up your intuition with concrete numbers.
It doesn't matter what you want to look at: you decide which tag to create and what information to collect.
Practical example: rebounds in korfball
I'm a korfball player myself and was curious about several aspects of the rebound (for non-korfball players: catching the ball after a missed shot near the basket).
So I asked myself a few questions:
- How often do we shoot from a distance (>5 m) without anyone positioned for the rebound?
- Where does the ball bounce after a shot?
- Which rebounds do we win ourselves, and which do we not?
With the last question, you also gain direct access to the associated video clips, so you can analyze why you win or lose a rebound.
Step 1: Create a teamtag and add attributes
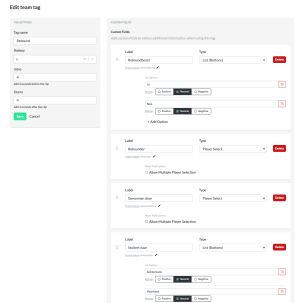
First, create a teamtag and add the extra attributes you want to fill in for each tag later.
Example
My teamtag is called: “Rebound”
The attributes I add are:
- Rebound covered?
(Yes / No) - Who was the rebounder?
(player list) - Rebound won by?
(player list) - Ball bounces to:
(front, back, side, goal) - Result:
- rebound won
- won by other 3 players
- lost directly in duel
- lost to other 3
- steal
Step 2: Add Tags during analysis
Now that the teamtag is created, you can use it to tag actions. You do this on the Tagging page. There, go to "Add custom tags" and click the tag you want to use. As you watch the video and the key moments appear, you can use your tag to record them.
In my case, I mainly tag shots from more than 3 meters, as these usually result in a rebound.

Step 3: Enrich Tags with extra information
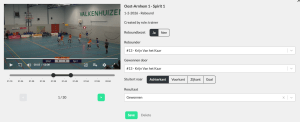
When multiple “Rebound”-tags are in the list, you can fill them in further.
- Click the pen (edit) next to a tag, as shown above in the tag list.
- Fill in the form with the correct information.
- Click the green arrow to the right to save.
Step 4: Analyze data in the Data Studio
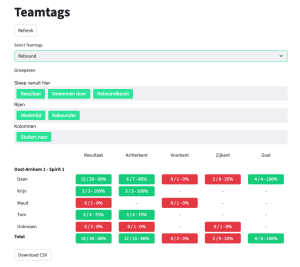
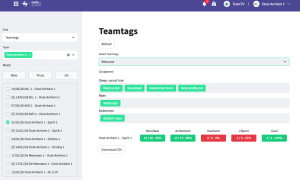
Now you can analyze the results of your Tagging in the Data Studio.
For example:
If you set “Ball bounces to” as a column, you'll see all the rebounds you've tagged, broken down by where the ball bounced. You'll also immediately see the rebound success rate.
By clicking on the numbers with a low success rate, you can directly view the associated video clips.
Possible analyses
By combining different attributes, you can gain many insights, for example:
- How often do we shoot without a rebounder, and what is the rebound success rate then?
- What are the rebound success rates per player, broken down by where the ball bounces?
- How many balls are lost directly in the rebound?
- How many rebounds are collected by players other than the rebounder?
✅ This way, you can test your coaching intuition against real data and immediately review the video to understand exactly what happens.