How to interpret the korfball livetagging dashboard
Updated on 18 Dec 2023
Introduction
When Livetagging is performed during the match statistics are generated that can be very usefull for the coaches during the match.
Getting started
If you go to the matches page you can see the live match of the day. Click on the 'Dashboard' icon.
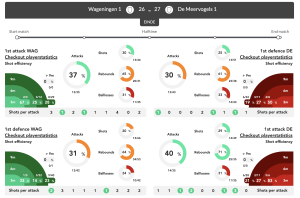
On this Dashboard you can see the 2 sections of every team. The statistics are shown for every section so you can see what's going on.
Slide to select a periode: the Slider in the top can be slides to hold quarters of the korfball match. By doing so you can see what the statistics of that period are.
Attack rendements: for every section you can see how many attacks have been played (1 ball into attack = one attack). And you can see how many goals are scored. So that gives you the attack percentage. This is a very important statistic.
The attack percentage is made up of:
- Shot percentage: you can see how many shots are taken by a section and how many where goals.
- Rebound percentage: how many rebounds are won in the section.
- Ball-loss percentage: how many times is the ball lost (without rebound loss).
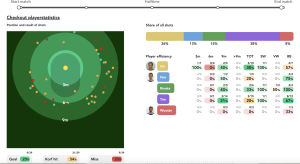
In the red en green sections you can see what the percentages of shots are in the different zones.
The bullits below the sections show you during the match the last 10 attacks of a section. If none of these bullits is green there is no score in ten attacks.
Advanced options
If you click on a section you can see the player statistics with percentages and numbers and locations